Data Visualization
Explore the latest insights and trends in data visualization for fintechs. Discover how iDENTIFY leverages tools like Power BI and Tableau to transform raw data into actionable insights.


Let’s modernize your bank’s data, together.
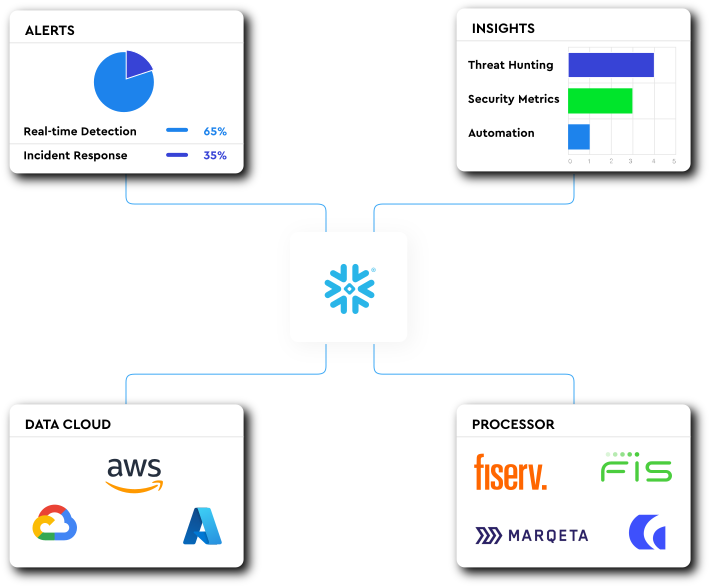

Explore the latest insights and trends in data visualization for fintechs. Discover how iDENTIFY leverages tools like Power BI and Tableau to transform raw data into actionable insights.


