Most Banks Don’t Even Realize They Have a Data Silo Problem (and why it’s expensive)
If it’s bad, you should fix it.
But that’s rarely the motto we’d use to describe the banking industry, especially when it comes to data infrastructure.
Instead, what I’ve seen more often than not is some banks have a tendency to be willing to export endless Excel files and email giant spreadsheets where the answers might be in there… somewhere… if you get just the right column of data and have a few spare hours to do some digging.
I think what happens is banks get used to the grind and stop questioning it. Maybe it even feels a little productive and possibly addictive in the same way as finally cleaning out spam marketing emails.
The idea of instant, up-to-date reporting and access to granular data remains inscrutable to many leaders.
Well, I mean, most can probably imagine the idea of it but it's more like a flying car in a cartoon but having zero expectations of buying one tomorrow.
What I mean is that it’s hard to visualize what’s possible today. That’s why I spend so much of my time in demos, showing how tools like Snowflake make it possible to build a custom LLM that someone in the mortgage department could use directly inside Microsoft Teams.
In a simple chatbox employees can use queries like, ”Who are our top 5% deposit holders this quarter?” And that knowledge doesn’t come at the cost of skipping lunch or staying late.
That’s a trendy possibility but the everyday reporting that banks have done for decades can be more precise and easier to disseminate.
What’s the Big Deal With Data Silos?
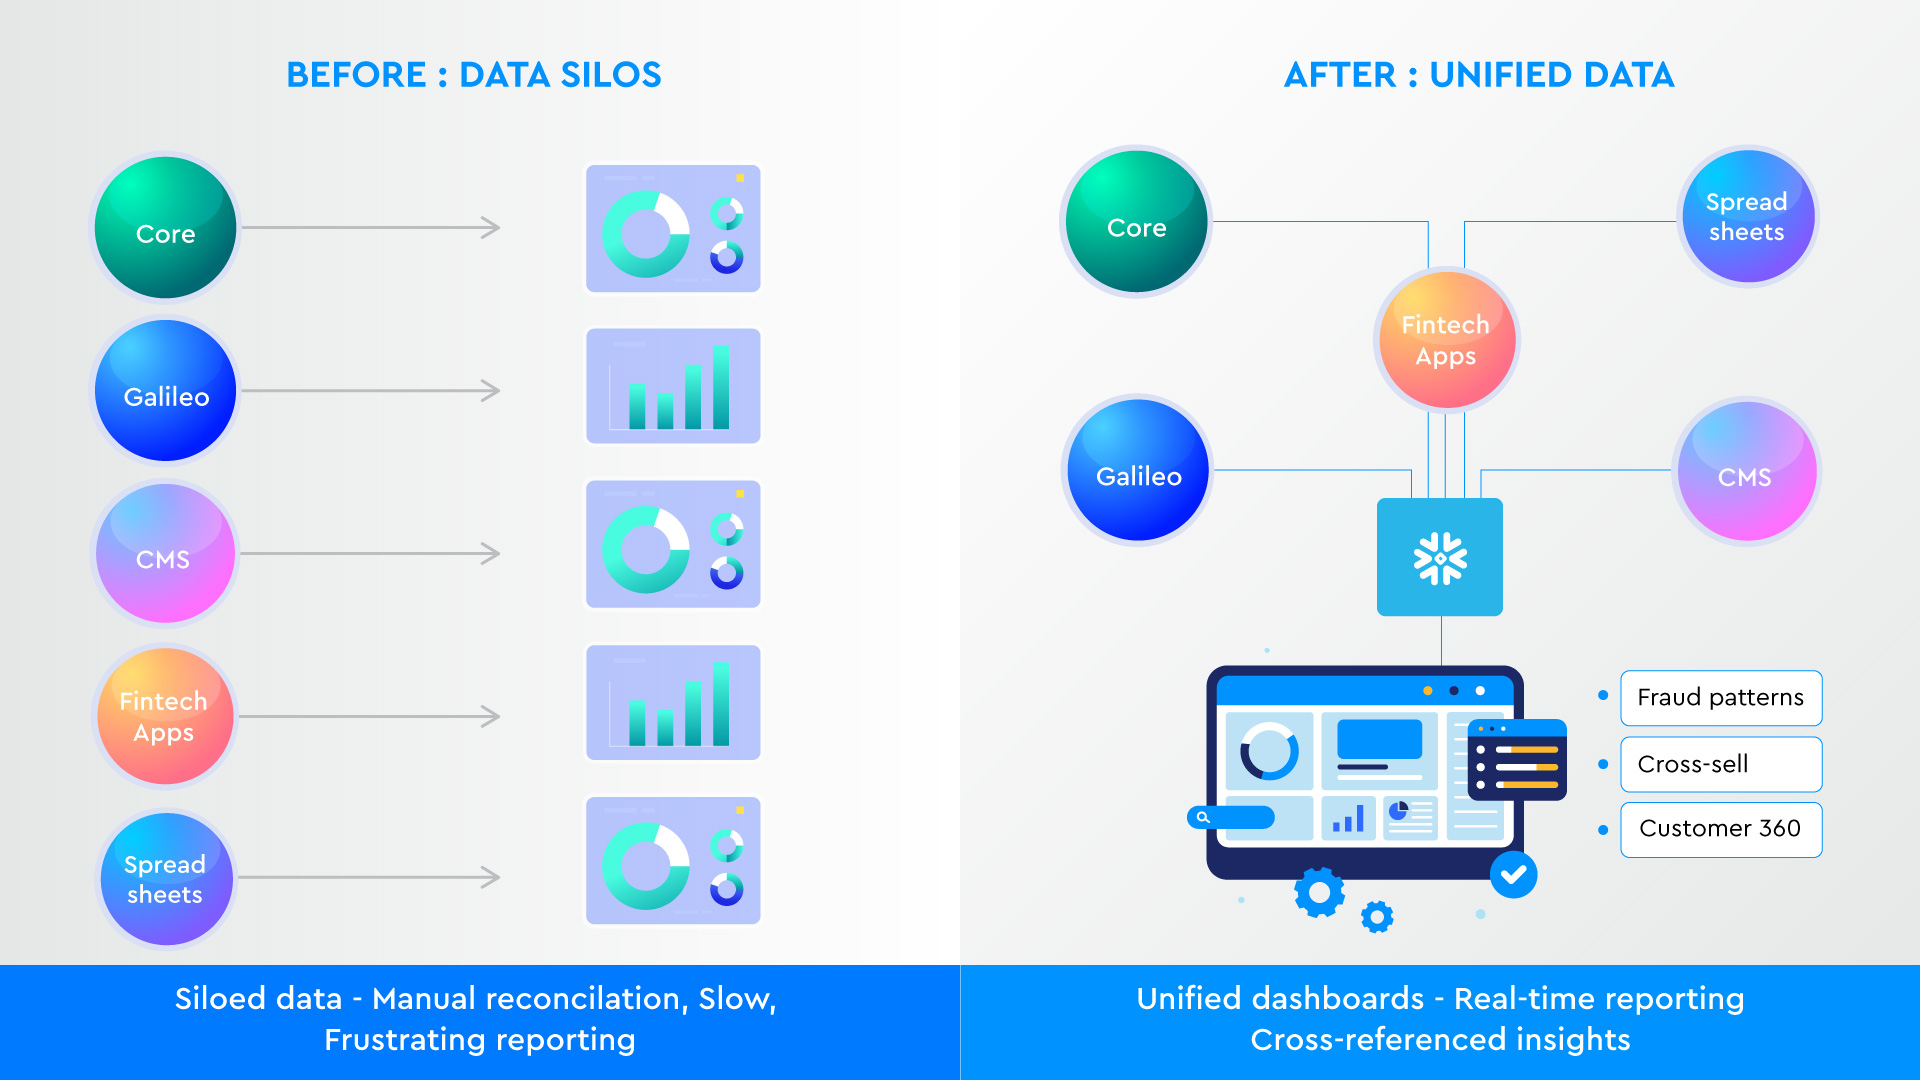
Most banks don’t even realize they have data silos. Have you ever counted how many different systems you have to check for a single report? If you’re pulling from Galileo, your core system, a CMS, a couple extra fintechs, and a few shared spreadsheets (and none of it lines up in the same format) you’re working in silos.
Even if you’re using AWS, cloud storage alone doesn’t mean your data is unified. Sure, you can technically find the information you need, but it takes a frustrating amount of effort.
The trouble is, “not broken” doesn’t mean “working well.”
The hardest part for many leaders is calculating the business value of possibility.
Will the investment in proper infrastructure really save time? Is a cleaner dashboard worth it? I will confidently answer both of those questions with yes.
The more challenging question is, how do you make a case for an investment that will likely require substantial resources. Especially when it all technically works, right?
We can only answer that question with more questions. Namely versions of, “what happens if you don’t?”
- What opportunities get missed?
- What mistakes slip by?
- Are your competitors positioned to be more innovative, agile, or resilient?
- How much longer will your team keep patching reports together instead of…anything else?
The payoff comes when you can cross-reference data.
For example, connecting small business deposits with their loan performance to uncover cross-sell opportunities. That’s where new opportunities appear. And with AI layered on top, even more connections surface: accounts linked by SSNs or addresses, householding across spouses, or spotting fraud patterns you couldn’t before.
These are the kinds of insights you can’t get from 2,000-row Excel reports. They only come when your data actually lives together in one place.
The bigger issue with Excel is that it has no drill-up or drill-down. It’s just a spreadsheet with everything dumped in. With a reporting tool, you can start with the big number and drill into region, state, even individual mortgages. You could try to do this in Excel by sorting eight different columns manually, but it’s painful and inefficient.
Dashboards also solve a bigger problem with consistency. The same report can go to the CFO and to a regional loan officer, but each can drill down to the level of detail they care about. The CFO might only want the overall number, while the loan officer wants to see what’s happening in the Southeast. Both get their answers from the same source, updated in real time.
Bankers spend an insane amount of time stuck in Excel. And the truth is, it’s hard to explain the time savings until you see it for yourself.
I haven’t had a single demo when the bank ever said “we don’t need something like this.”
Schedule time to talk to our team to learn more about your bank’s data possibilities.
A Quick Example of Possibilities
When banks finally connect their data, the insights can be surprising. A customer might move their savings into a fintech offering 3.8% instead of the bank’s 1%. On the surface, it looks like lost deposits. But in reality, the bank still owns the asset. It’s just held in an FBO account.
If banks are indirectly funding fintechs to offer high-yield savings, why not rethink their own products or offer multiple products, expand choices, and capture value directly instead of ceding ground to fintechs.
These are the kinds of strategic decisions that only come into focus when the data stops living in silos.
The Problem Isn’t Getting Easier or Cheaper to Solve
On-premise storage isn’t going to disappear overnight, but the writing is on the wall. In 10 to 15 years, every bank will be in the cloud. Some traditional banks still run SQL servers in their offices, but that comes with constant investment.
- Buying new hardware as servers age.
- Paying a full-time DBA (often ~$200k/year) or loading that responsibility onto the CTO.
- Burning IT staff time on maintenance instead of innovation.
With Snowflake, most of the upkeep is handled for you. Your team just manages the data, not the hardware.
Then there’s integration, and in the cloud, it’s usually a pre-defined connector. If I want to move data between HubSpot and Snowflake it is easy. On-prem often requires you to build custom code.
The longer silos sit and the more you collect, the problem grows exponentially and untangling it takes more time and more resources.
How Our Work Eliminates Data Silos
When banks first hear “data lake” and “data warehouse,” it can sound abstract. In practice, it’s simpler.
Think of AWS (Amazon Web Services) or Azure as the storage locker. Files get dropped there (usually as CSV exports) and they can sit there forever. It’s cheap, reliable, and unlimited, which is why banks use it for long-term storage. That’s your data lake.
Snowflake sits on top of that storage. It takes the raw files from AWS and organizes them so you can actually use them. Snowflake acts as the warehouse floor, where everything is cleaned up, structured, and ready for reporting. From there, tools like Power BI connect directly to Snowflake to create dashboards, graphs, and drill-down analytics.
So the flow looks like this:
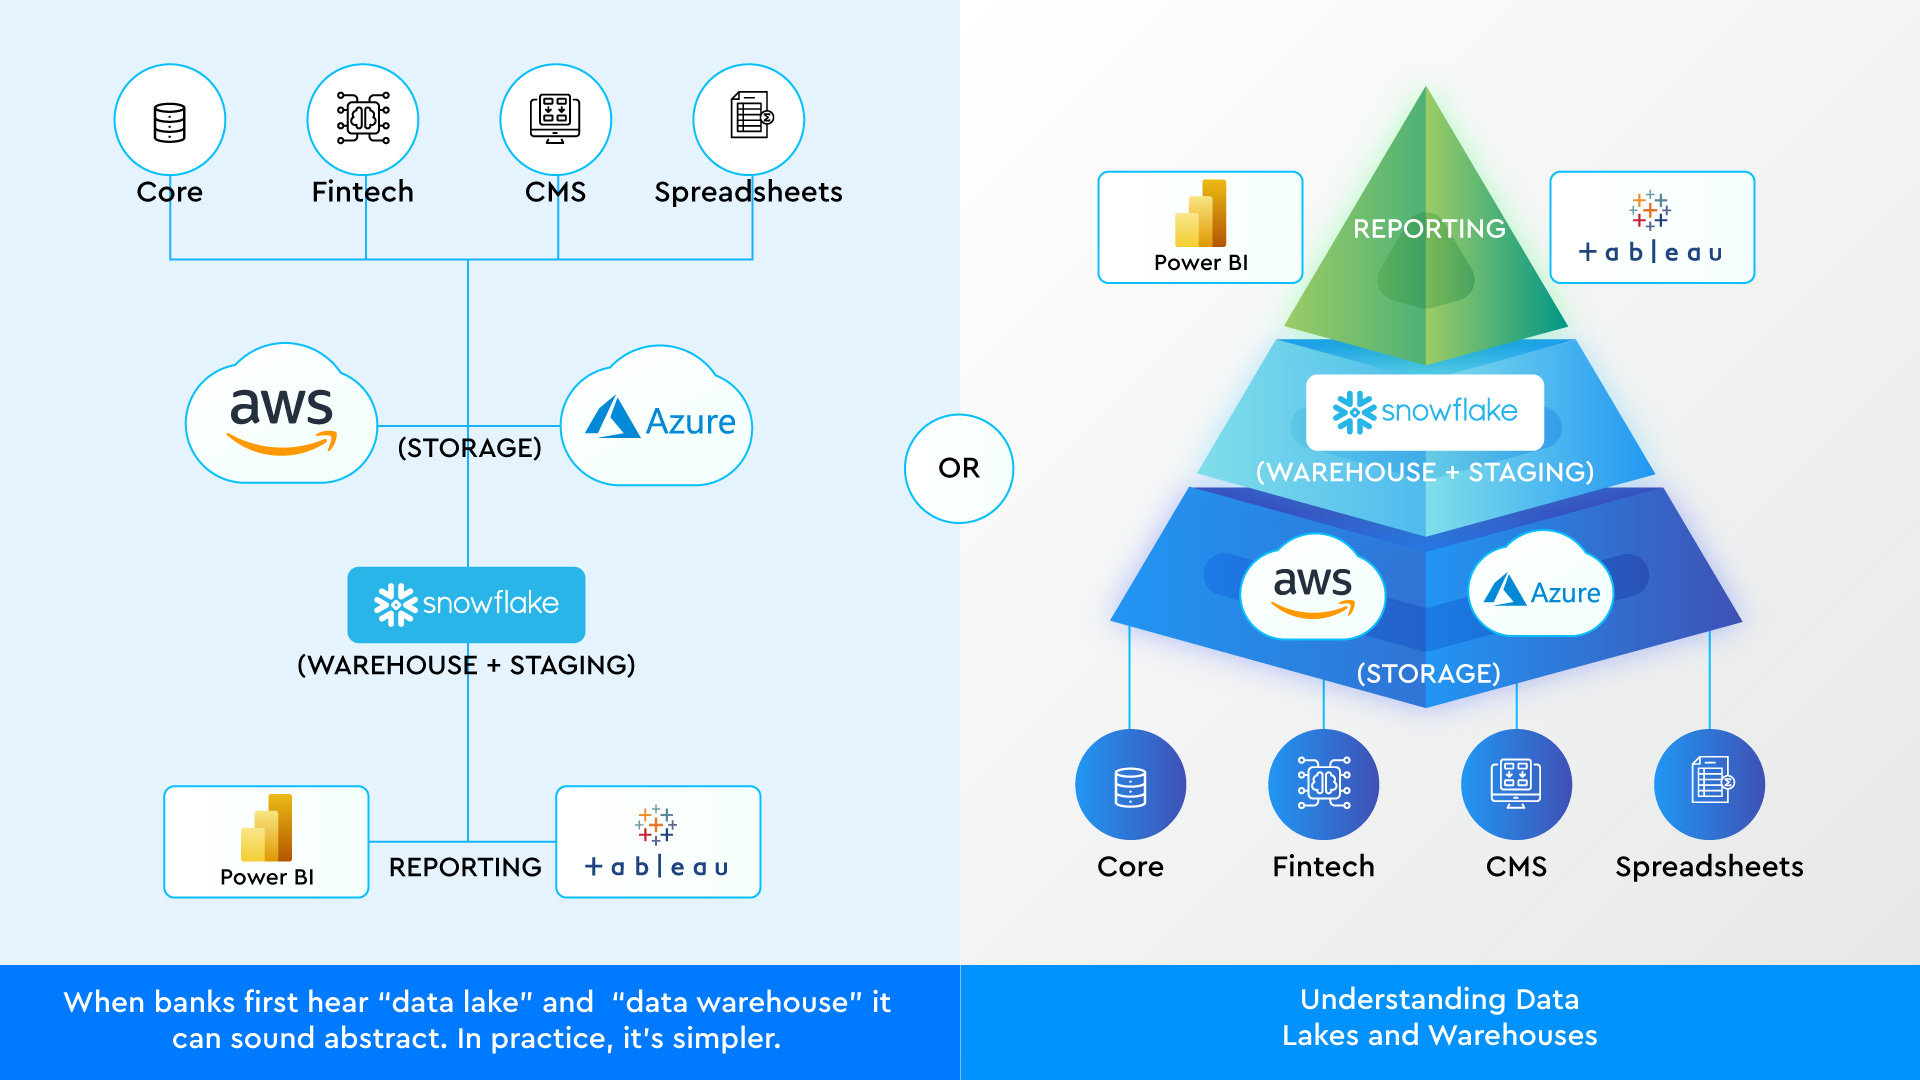
Data source (core, fintech partner, CMS, spreadsheets) → AWS (storage) → Snowflake (warehouse + staging) → Power BI (reporting).
When we do this work, our clients don’t have to keep patching reports together. They can store raw data safely, then build a warehouse that transforms that raw material into insights they can actually use.
Contact our team to learn more about how modern data infrastructure can improve bank operations. We’ll show you how to connect your existing systems. With the right foundation, your team can stop patching together spreadsheets and start focusing on decisions that move the business forward.