In November 2023, the Consumer Financial Protection Bureau (CFPB) fined Bank of America $12 million for not recording and reporting specific demographic data required for mortgage lending.
It was a single customer complaint in 2020 that surfaced the widespread problem. Loan officers were required to read a detailed script for phone applications, but many didn’t, leaving applications (and the required data) incomplete.
Notably, phone applications handled by loan officers at local branches received less oversight than those processed by loan officers in central offices. This allowed inaccuracies to accumulate and escalate unnoticed.
Once it was discovered, though, Bank of America stepped up training and prioritized recording loan-officer calls. However, when the CFPB started investigating, many loan officers were still failing to follow proper procedures. By then, it was too late, and they had a multi-million-dollar problem.
Training and oversight were helpful long-term solutions for Bank of America, but the reason they didn’t discover their problem sooner was arguably data silos.
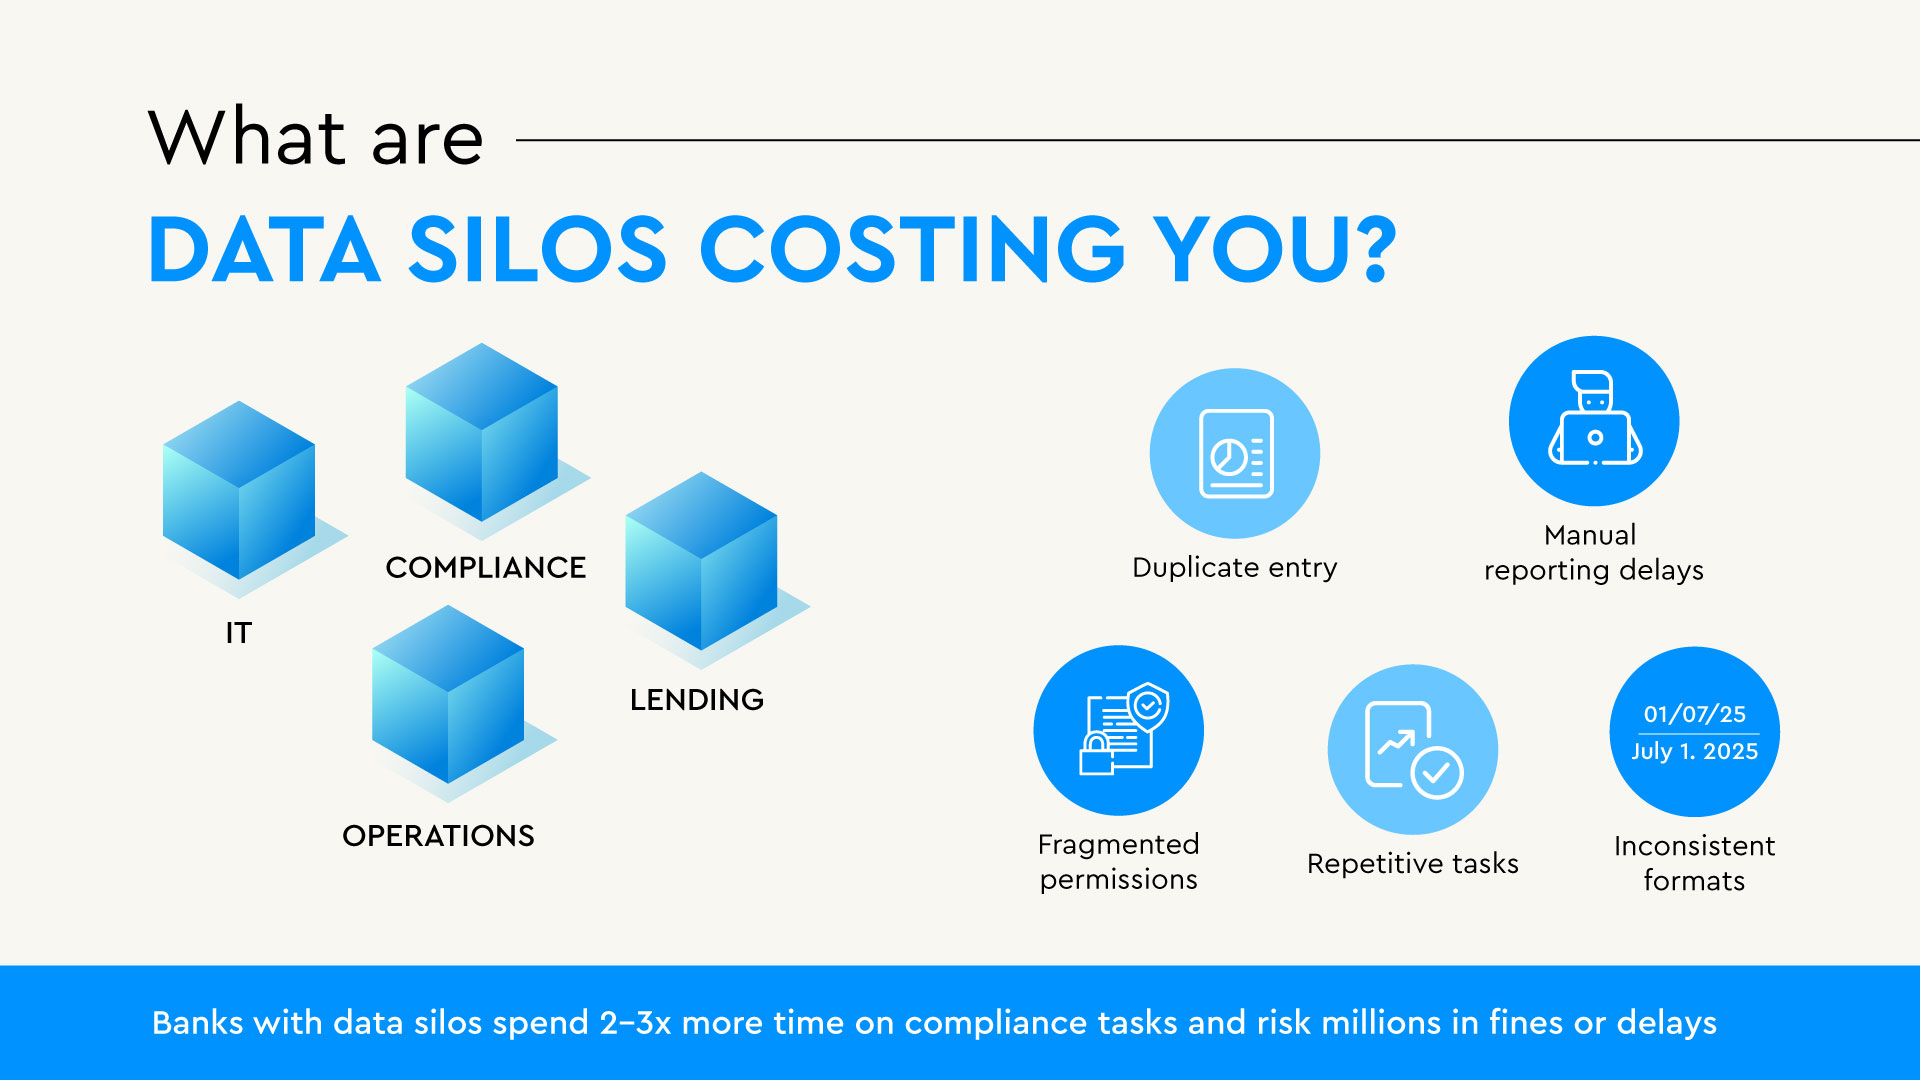
What are Data Silos?
Data silos happen when information is trapped in different departments or systems within an organization, preventing easy access, integration, and effective use of the data. They lead to inefficiencies, duplicated efforts, inaccurate reporting, and missed opportunities.
There are many solutions to help eliminate data silos in banking. For example, cloud infrastructure lowers scaling costs and helps with real-time reporting. Unlike traditional systems that rely on batch processing and third-party reporting, platforms like Snowflake allow banks to centralize data from across their ecosystem, automate updates, and run on-demand queries, cutting manual work and reducing infrastructure costs. But many banks need to start this work before solutions by identifying the impact of data silos and communicating it with leadership. When they do know what it costs, they can measure the effect new strategies have on the bottom line.
Learn how one of our clients, Sutton Bank, migrated its data to the cloud.
Estimating the Expense of Banking Data Silos
Banks gather large volumes of data. Many sift and sort it sometimes with the goal of business growth, and that’s good. But when data is difficult to find, it's not just missed opportunities that matter; it costs something. Yes, that could be a fine for failing to comply with regulations, but sometimes it’s an even quieter, ongoing expense.
Data silos hinder innovation, damage customer experiences, and create hidden costs that make competing with larger financial institutions even tougher.
We’ve outlined methods to help you measure the cost of data silos in your bank. Doing this work gives you clear benchmarks to track process improvements and helps you pinpoint exactly where new strategies could deliver meaningful savings.
Labor Costs:
Reporting tasks consume a considerable portion of total staff hours at community banks, driven by the need to fulfill regulatory requirements and produce internal management reports.
Recent studies and industry surveys quantify this burden and show that smaller financial institutions and community banks invest a larger share of their budgets on data tasks compared to national banks.
- A report by the Community Banking Research Conference Smaller banks (e.g., community banks) typically allocate about 1.5% of their total noninterest expenses specifically to data processing related to compliance. In contrast, larger banks typically spend only 0.6% of their total operating expenses on the same tasks.
- The Independent Community Bankers Association conducted a survey and found that even routine reporting like the quarterly Call Report demands substantial effort. Community banks under $1 billion must complete 51 pages of Call Report schedules each quarter (larger banks file ~80 pages quarterly). The survey also reported, “The annual cost of preparing the call report has increased for 86 percent of survey respondents over ten years.”
- Certain required reports are especially labor-intensive. For example, one community bank told the Government Accountability Office that its staff spent roughly 16 hours per week just to compile and report mortgage loan data under the Home Mortgage Disclosure Act.
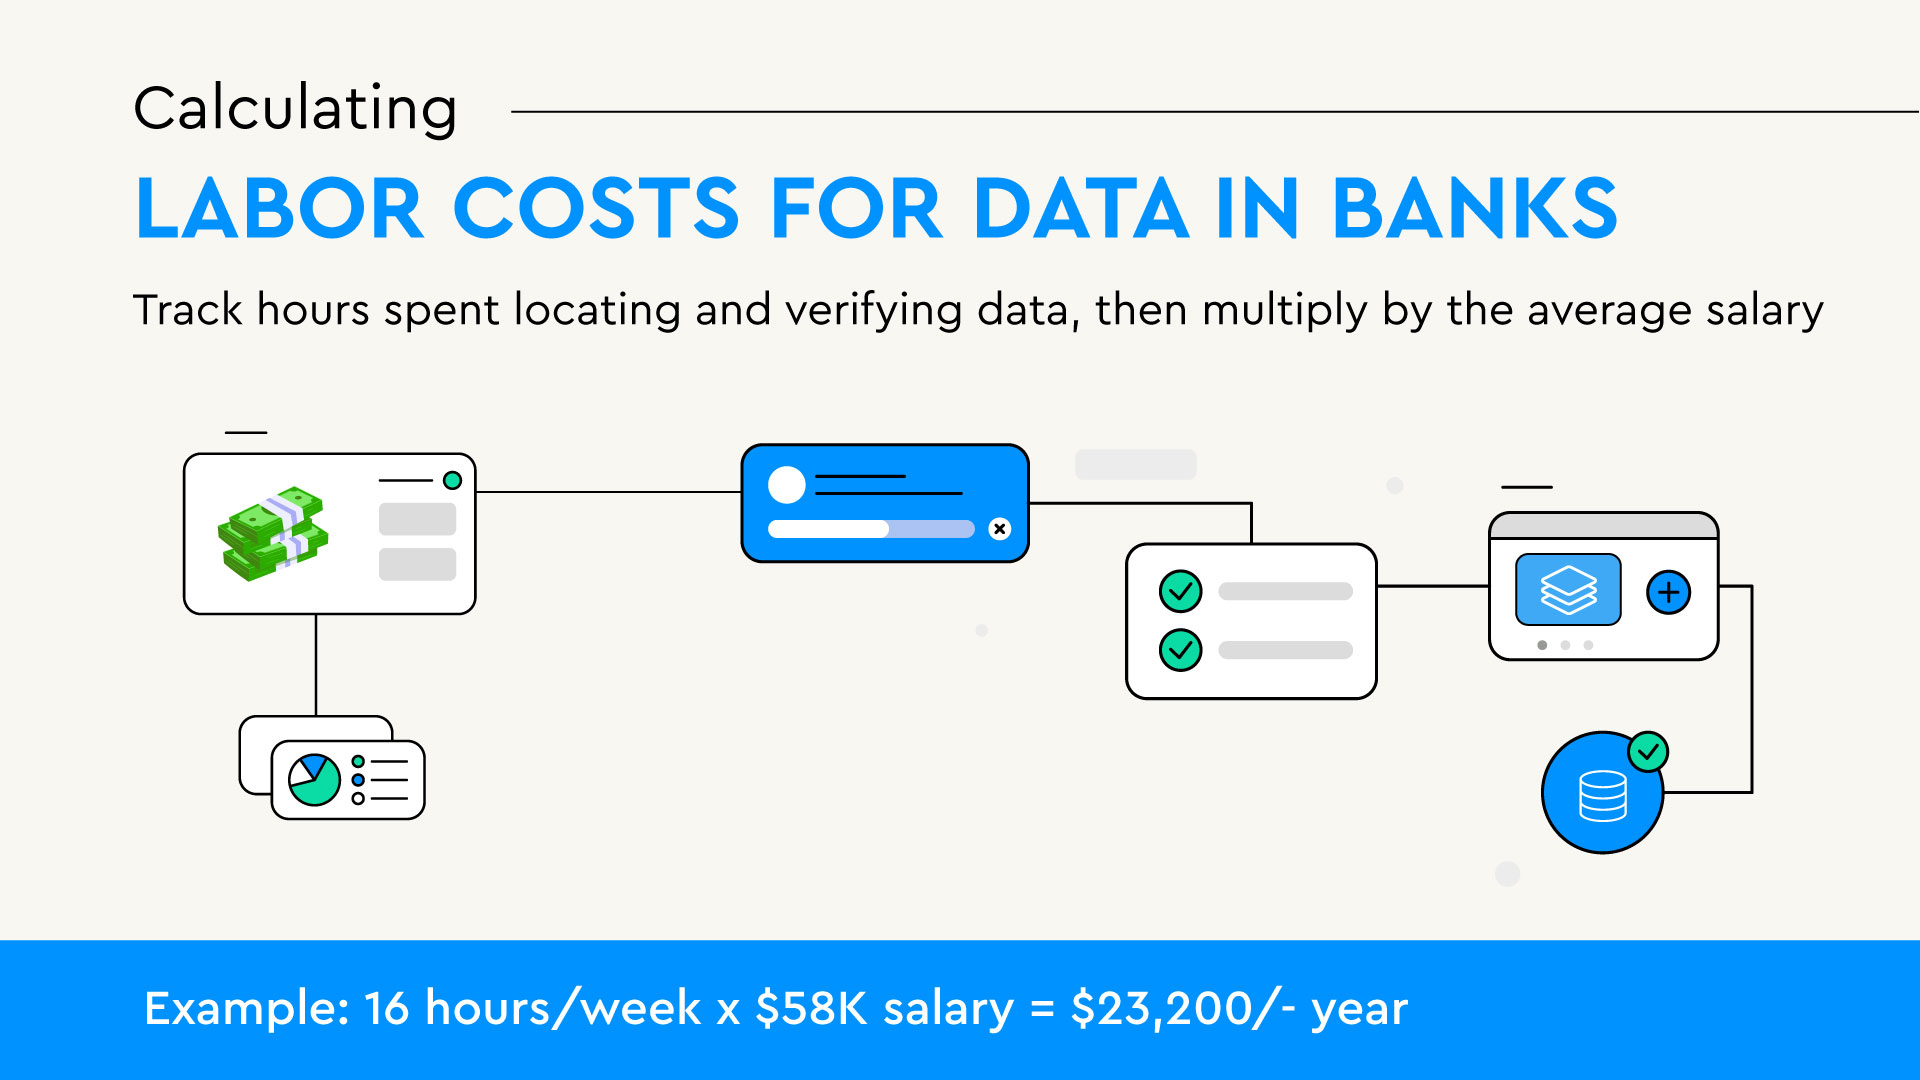
Calculating Labor Costs for Data in Banks
To understand labor costs related to data management, start by selecting one week to closely track the time your teams spend locating, gathering, and verifying data. If there's a particular week each month when reporting demands are highest, focus on that week.
Time tracking work is an additional burden and often uncomfortable, but communicate to your teams that this short-term exercise is to help identify sluggish software or friction points in data workflows. You can also choose one team to serve as a small representative sample to get a general estimate.
It's not just about how long the tasks take. Teams should also track how many different tools they use. This will help you see if more tools mean more time spent, or if certain tools are more problematic than others.
After collecting time data, multiply the average salary and recorded hours to calculate the estimate of labor costs linked to data silos.
For example, when one bank said its staff spent roughly 16 hours a week compiling mortgage data for reporting, the labor cost would be $23,200 if the average salary of the people responsible for the task was $58,000. They could identify how many data silos are in the process, eliminate them, and measure if it reduces time and document the savings.
Productivity Costs
While banks have access to more tools than ever before, limited integration often leads to more work, not less. It creates a costly slowdown when employees are entering, validating, or retrieving data.
Entry and Accuracy
- Duplicate Data Entry: Employees key the same customer details into two (or ten) different screens. Precious minutes disappear, and every extra keystroke invites a typo that someone must fix later.
- Errors from Manual Entry: Two systems disagree on a customer’s address, and now someone has to determine which (if either) is correct. Also, when nothing is the definitive source, every figure needs a double-check, and decisions stall under layers of verification.
- Batch-Only Updates: When data syncs overnight instead of in real time, employees act on stale figures.
- Inconsistent Formats: One database says 01/07/25 while another says July 1 2025. Automated hand-offs fail, forcing people to clean up the mess by hand.
Data Workflow Delays
- Fragmented Permissions: Different systems mean different rights. While IT grants temporary access, employees sit idle or invent less effective workarounds.
- Specialized Training: Every platform has its quirks. Onboarding drags on, and work halts when the only expert takes a day off.
- Constant Context-Switching: To complete one task, staff bounce between interfaces that look nothing alike. Mental energy drains, calls drag on, and reports land late.
- Hidden Data: Staff might build their own trackers in the absence of better options, and data shuttles in and out of CSV files. Every transfer risks errors and demands extra oversight. Teams needing information might submit a request and wait, often choosing to work half-blind just to keep moving.
Calculating Productivity Costs
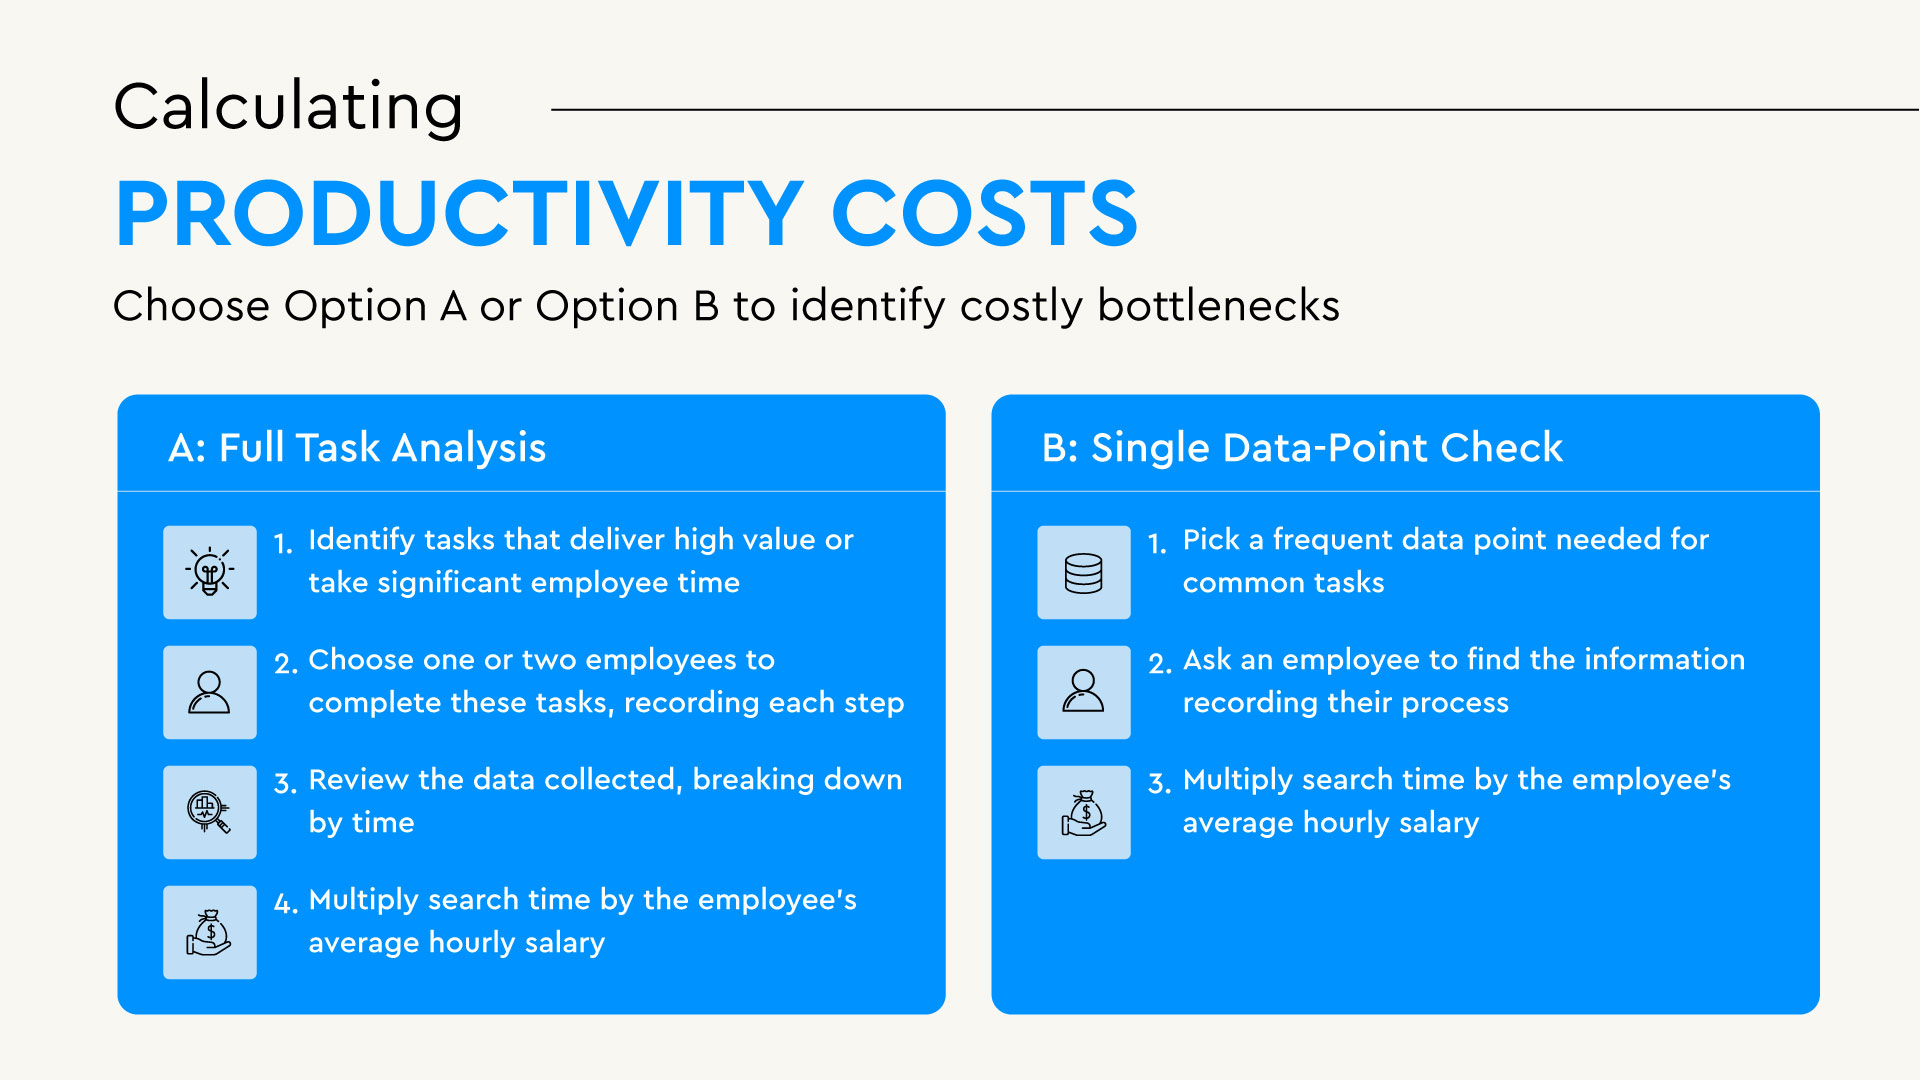
You can identify exactly how data silos slow your bank in two ways. Option A shows a full, detailed view of your processes, while Option B identifies the data that's hardest and most costly to access.
Option A: Full Task Analysis
Step 1: Identify tasks that deliver high value or take significant employee time.
Step 2: Choose one or two employees to complete these tasks, recording each step. They should note the tools used, the duration of each action, and any delays, like waiting for approvals or software access.
Step 3: Review the data collected. Break it down by total time per sub-step, looking for delay frequency and length.
Step 4: Calculate the actual cost of finding this data point by multiplying the search time by the employee’s average hourly salary.
Using this approach, you'll quickly spot where employees lose time hunting down information, and which tools either simplify or complicate their work. Repeating this exercise across various reporting tasks will clearly identify your most costly bottlenecks.
Option B: Single Data-Point Check
Step 1: Pick a frequent data point needed for common tasks.
Step 2: Ask an employee who regularly handles this task to find the information. Record how they searched for it, which tool they used, and how long the search took.
Step 3: Calculate the cost of finding this data point by using the average salary of the person who is looking for it and how long it takes.
This focused approach quickly identifies your bank’s most troublesome data points or least-effective tools. It's particularly helpful when the same information is used repeatedly across different departments or workflows. Plus, it’s quicker and simpler than fully mapping a task from start to finish.
Software Costs
Software costs are straightforward compared to labor and productivity. They include explicit licensing fees, subscriptions, integration, maintenance, and training expenses. Evaluating these is simpler because they involve direct expenditures. But keep in mind that cost savings from removing redundant tools or streamlining software should always be balanced against their impact on employee efficiency and customer service.
Reporting Data Silo Expense
A survey by Airtable and Forrester, Crisis of a Fractured Organization, found that large organizations use an average of 367 different software apps and systems to manage their workflows. Notably, employees lose 2.4 hours daily (≈12 hours weekly) chasing scattered data. They also found that fractured data drops productivity by 24% and decreases revenue by 31%.
Even if your bank doesn’t qualify as a large organization with 20,000 or more employees, it’s likely your teams are encountering the same friction of too many tools slowing them down.
When you evaluate data costs comprehensively, you move beyond simply calculating the time spent or tools used. Instead, you're examining exactly how many different tools your teams rely on for each task, and where slowdowns happen. Team feedback surveys also help verify if your findings accurately represent the broader organization.
This detailed analysis reveals opportunities not just to consolidate or simplify tools, but also where innovation can improve current and future processes. Once you have benchmarks, you can roll out new data strategies and track their impact.
But remember, some costs won't immediately appear in standard metrics or reports. Certain hidden inefficiencies and frustrations erode productivity, morale, and customer satisfaction.
Indirect Costs of Data Silos
Not every cost shows up on a balance sheet. Some take the form of mounting frustration, degraded trust, or compliance risk hiding in plain sight.
When data is fragmented across departments or systems, it wears people down. Employees spend their time tracking down missing fields, validating inconsistent numbers, or troubleshooting preventable issues. Over time, this leads to disengagement and turnover—not because people hate the work, but because the systems make it harder than it should be.
These inefficiencies can be especially damaging in compliance teams.
In AML and BSA functions, data silos don’t just slow things down—they create blind spots. Teams can’t confidently verify identities, surface anomalies, or respond to alerts when key data points live in disconnected systems. The result is duplicated effort, inconsistent monitoring thresholds, and incomplete audit trails that erode both readiness and trust.
Customers feel it too. A flagged transaction might be nothing more than an outdated address or missing field. But without clean, unified data, delays pile up—and repeated ID checks or transaction holds chip away at customer confidence.
In sponsor banking, where expectations are high and regulators demand precision, this kind of fragmentation becomes a systemic risk. Manual reconciliation and inconsistent reporting are more than annoyances—they’re vulnerabilities that grow with every new fintech program you support.
Without unified, real-time visibility, even the best compliance strategies are hamstrung. And the longer teams operate in the dark, the greater the risk—not just of fines, but of losing the people and trust that make your bank work
(For a closer look at how modern data infrastructure strengthens transaction monitoring and fraud detection, check out our breakdown here.)
How iDENTIFY Helps Community Banks Unify Data
At iDENTIFY, our work always begins with the Discovery phase. This is where we get a clear picture of where your bank stands today—technically, strategically, and operationally.
Our team meets directly with executives, IT leaders, analysts, and frontline staff to understand your priorities, challenges, and opportunities. We listen carefully, define high-level goals, and shape an initial scope of work. From there, those goals are translated into technical requirements and assigned to the right teams for execution.
We also evaluate your entire data ecosystem—core banking platforms, loan systems, CRMs, spreadsheets, and reporting tools—to identify silos and uncover the friction they create.
By the end of Discovery, we’re aligned on what success looks like—so every step we take from there is measurable, meaningful, and grounded in your real-world needs.
Learn More About Our Platform or contact our team to talk more about solutions for data silos.